The AI ROI Playbook for Fashion Product Development
TL;DR: Measuring the ROI of AI in fashion product development requires moving beyond generic productivity metrics to track workflow-specific data like pattern rework hours, fabric waste, and cycle times. This playbook provides a structured approach, including baseline data collection, A/B testing methodologies, and CFO-ready reporting templates. Follow these steps to build a defensible business case for scaling AI tools in your design process.
Most AI ROI guides tell you to "measure productivity gains" and "calculate total investment." That advice is accurate in the way that "eat less, move more" is accurate about weight loss. It's technically correct and operationally useless.
Fashion product development teams face a specific problem. Your value chain runs sketch→pattern→sampling→tech pack→costing, and every stage has its own time sinks, rework loops, and quality gates. A generic ROI formula doesn't tell you which fields to log, how long to run the pilot before the data means anything, or what format your CFO will actually sign off on.
This playbook gives you exactly that: a structured pilot design, fashion-specific baseline fields, copy-paste CSV templates, an analysis methodology, and a one-page reporting format built for procurement and finance review.
Who this is for: Product development leads, digital transformation directors, and operations heads in fashion brands running 50+ styles per season who are evaluating or already piloting AI tools in patternmaking, tech pack generation, BOM sourcing, or costing workflows.
Prerequisites: Access to historical style records spanning at least one comparable season, a defined team or cohort available for the pilot, and a basic spreadsheet tool (Excel or Google Sheets).
Difficulty: Moderate. The data collection is straightforward; the analysis requires basic statistical literacy.
Expected time: 2-4 weeks for baseline collection; 8-12 weeks for the pilot itself; 1-2 days for analysis and reporting.
Step 1: Define a single-use-case pilot scope
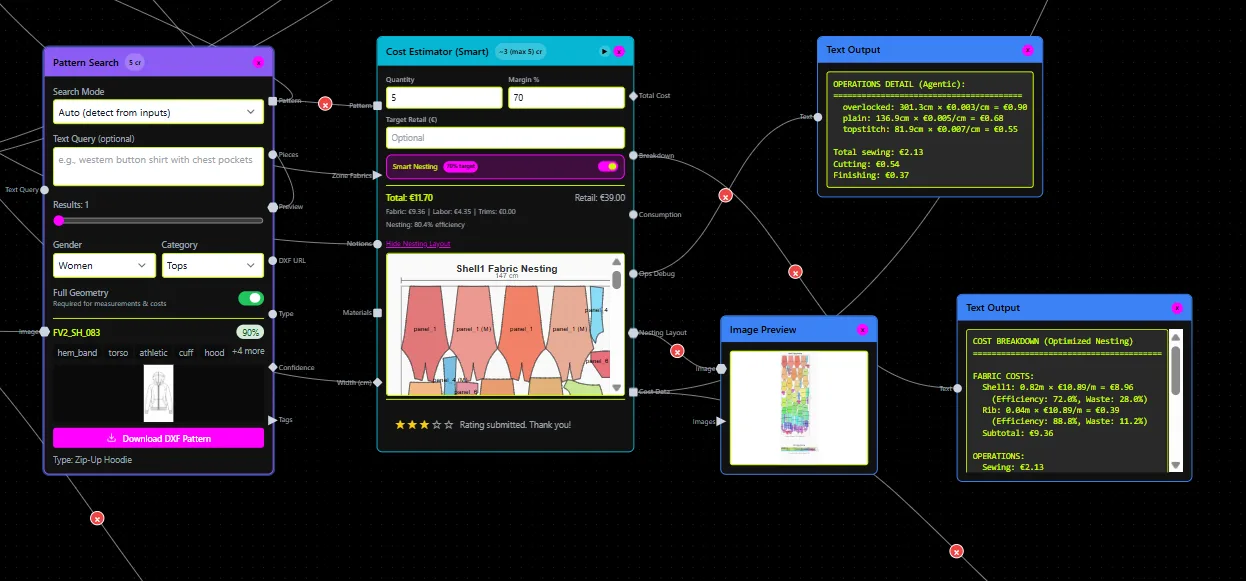
Pick one workflow node. Not two, not "the whole design process." One.
Good candidates for a first AI ROI pilot in fashion product development are:
- Pattern intelligence (retrieving closest-match blocks vs. drafting from scratch)
- Tech pack compilation from existing measurement data
- BOM/fabric specification generation and sourcing lookups
- Cost estimation updates when construction complexity changes
Each of these has a clear input, a measurable output, and an obvious counterfactual (what the team did before). Multi-use-case pilots make attribution nearly impossible. When you try to prove ROI across three workflow changes simultaneously, you can't credibly separate the signal from each one.
Once the use case is selected, write down the expected ROI drivers in fashion-specific terms:
- Cycle time: Calendar days from approved sketch to production-ready tech pack
- Rework hours: Pattern revision hours per style; tech pack revision rounds
- Sample count: Number of physical samples per style before first factory approval
- Material waste: Fabric yards/meters consumed per style above the theoretical cut
- Documentation throughput: Tech packs generated per designer per week
Choose your measurement approach before collecting any data. Two options:
Before/after (same team, same process): Collect baseline metrics from the previous season or a defined pre-pilot window. Apply the AI tool. Measure the same fields during the pilot window. This is simpler but vulnerable to confounding factors (new suppliers, team changes, seasonal category shifts).
A/B (control vs. pilot cohort): Split comparable styles or teams. One group uses the AI tool; the other uses the existing process. Measure both simultaneously. This design is stronger for attribution but requires enough styles per cohort to be statistically credible (minimum 20 styles per cohort; 30+ preferred).
Set a stabilization window. This is where most fashion AI pilots fail. Early-phase outputs require more correction, prompting, and QA review than steady-state outputs do. Do not start measuring ROI in the first two to three weeks of using any AI tool. Require a QA/acceptance gate: outputs from the AI tool must pass the same review standard your team applies to human-drafted patterns or tech packs before they count as "accepted." Measure ROI on accepted, manufacturable outputs only.
Define success criteria before the pilot starts. For example: "A statistically meaningful reduction in average days from sketch to production-ready tech pack, with no reduction in fit acceptance rate, across at least 25 pilot styles." Write down what "no ROI" looks like too. If the delta is below your minimum threshold, that's a valid result and one your CFO needs to see documented.
Step 2: Collect the right baseline fields
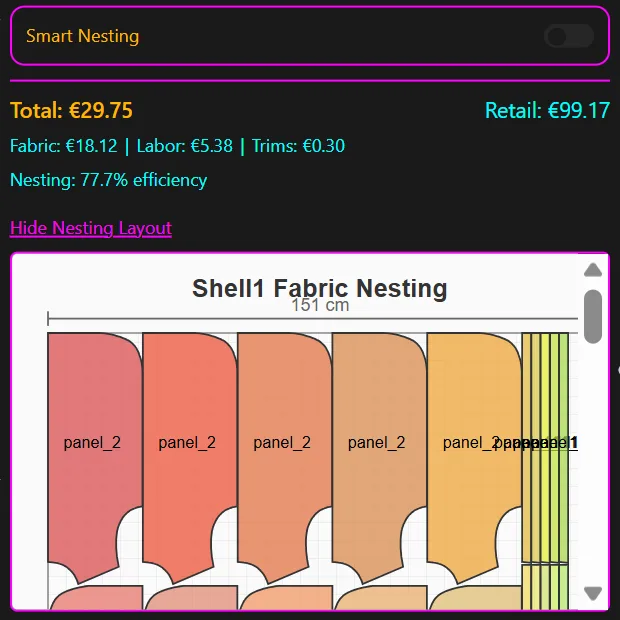
Most fashion teams underestimate how much pre-existing data they already have in PLM systems, shared drives, and email threads. Pull it before the pilot starts.
Operational and financial fields
Capture these for every style in your baseline period:
| Field | Unit | Notes |
|---|---|---|
| Style_ID | Text | Unique identifier |
| Category | Text | e.g., woven top, trouser |
| Sketch_Date | Date | Date sketch approved |
| Pattern_Start_Date | Date | Date patternmaking begins |
| Production_Ready_Date | Date | Date tech pack accepted by factory |
| Pattern_Rework_Hours | Decimal hours | All revision rounds combined |
| Tech_Pack_Revision_Count | Integer | Rounds before factory acceptance |
| Physical_Sample_Count | Integer | Number of samples produced per style |
| Fabric_Usage_Actual_m | Decimal meters | Actual fabric consumed in sampling |
| Fabric_Usage_Theoretical_m | Decimal meters | Spec sheet or nesting estimate |
| Sampling_Rework_Cost | Currency | Cost of rejected samples/rework |
| Labor_Hours_Pattern | Decimal hours | Patternmaker time only |
| Labor_Hours_Tech_Pack | Decimal hours | Tech pack writer time only |
| QC_Rejection_Count | Integer | Rejections at any internal QC gate |
| Fit_Acceptance_Round | Integer | Which sample round first passed fit review |
AI cost fields (the denominator)
This is where organizations consistently under-report, which is why Deloitte's 2025 analysis found that only 20% of organizations can demonstrate measurable revenue outcomes from AI, and the figure drops to 15% for generative AI specifically. Hidden costs kill credibility with CFOs.
Track every cost line item:
- Tool license or credit cost (monthly/annual, allocated per style or per seat)
- Onboarding and training time (hours by role, at fully loaded labor rate)
- Data preparation time (cleaning pattern archives, formatting specs for ingestion)
- Integration and setup time (IT, security review, SSO/RBAC configuration)
- Governance and QA time (time spent verifying AI outputs before acceptance)
- Ongoing compute or API costs if applicable
Quality guardrails
Faster is only valuable if the output is manufacturable. Collect:
- Fit_Acceptance_Rate: percentage of styles where first AI-assisted pattern passed fit review
- Tolerance_Compliance_Rate: percentage of measurements within spec tolerance on first sample
- Post_Factory_Review_Changes: number of changes requested after the first factory review
- Sampling_Acceptance_Rate: percentage of samples passing QA without rework
Control variables
Document anything that changed during the pilot period that could explain results independently of the AI tool: team roster changes, new suppliers, seasonal category shifts, factory lead-time changes. These become your sensitivity disclosures in the CFO report.
Step 3: Set up your data collection templates
Three templates. Use them as-is or adapt column names to your existing naming conventions.
Template 1: Pilot Run Log (one row per style)
Style_ID, Category, Season, Cohort (AI/Control), Sketch_Date,
Pattern_Start_Date, Production_Ready_Date, Days_to_Production*,
Physical_Sample_Count, Fit_Acceptance_Round, Tech_Pack_Revision_Count,
Fabric_Usage_Actual_m, Fabric_Usage_Theoretical_m, Fabric_Waste_m*,
Sampling_Rework_Cost, QC_Rejection_Count, Pilot_Notes
Derived columns (calculate in spreadsheet):
- Days_to_Production = Production_Ready_Date - Sketch_Date
- Fabric_Waste_m = Fabric_Usage_Actual_m - Fabric_Usage_Theoretical_m
Template 2: Workflow Time and Rework Ledger (one row per task instance)
Log_ID, Style_ID, Task_Type (Pattern/TechPack/BOM/Costing),
Date, Assigned_Role, Hours_Spent, Task_Status (Initial/Revision/QA),
Output_Accepted (Y/N), Rejection_Reason, AI_Tool_Used (Y/N),
AI_Output_Accepted_Without_Edit (Y/N), Edit_Time_if_Modified_hrs
This ledger is what separates a defensible ROI calculation from a guess. It lets you track the real time cost of QA and correction loops, which always exist in early AI adoption phases.
Template 3: Stakeholder sign-off
KPI_Name, Baseline_Value, Target_Value, Minimum_Acceptable_Delta,
Measurement_Method, Data_Owner, Accept_Criteria, Reject_Criteria,
Sign_Off_Owner, Sign_Off_Date, Decision (Proceed/Hold/Stop)
This template should be completed and signed before the pilot starts. When you present results to procurement or the board, you're comparing against pre-agreed targets, not numbers chosen after the fact.
Minimum sample size guidance: With fewer than 20 styles per cohort, report ranges rather than point estimates and flag the limitation explicitly. Between 20 and 30 styles, results are indicative. At 30+ styles per cohort, difference-in-means calculations are defensible for a business decision, though not publication-grade statistics. If your pilot covers fewer styles, consider extending the measurement window or pooling two comparable seasonal categories.
Step 4: Run the analysis (delta, annualization, and ROI)
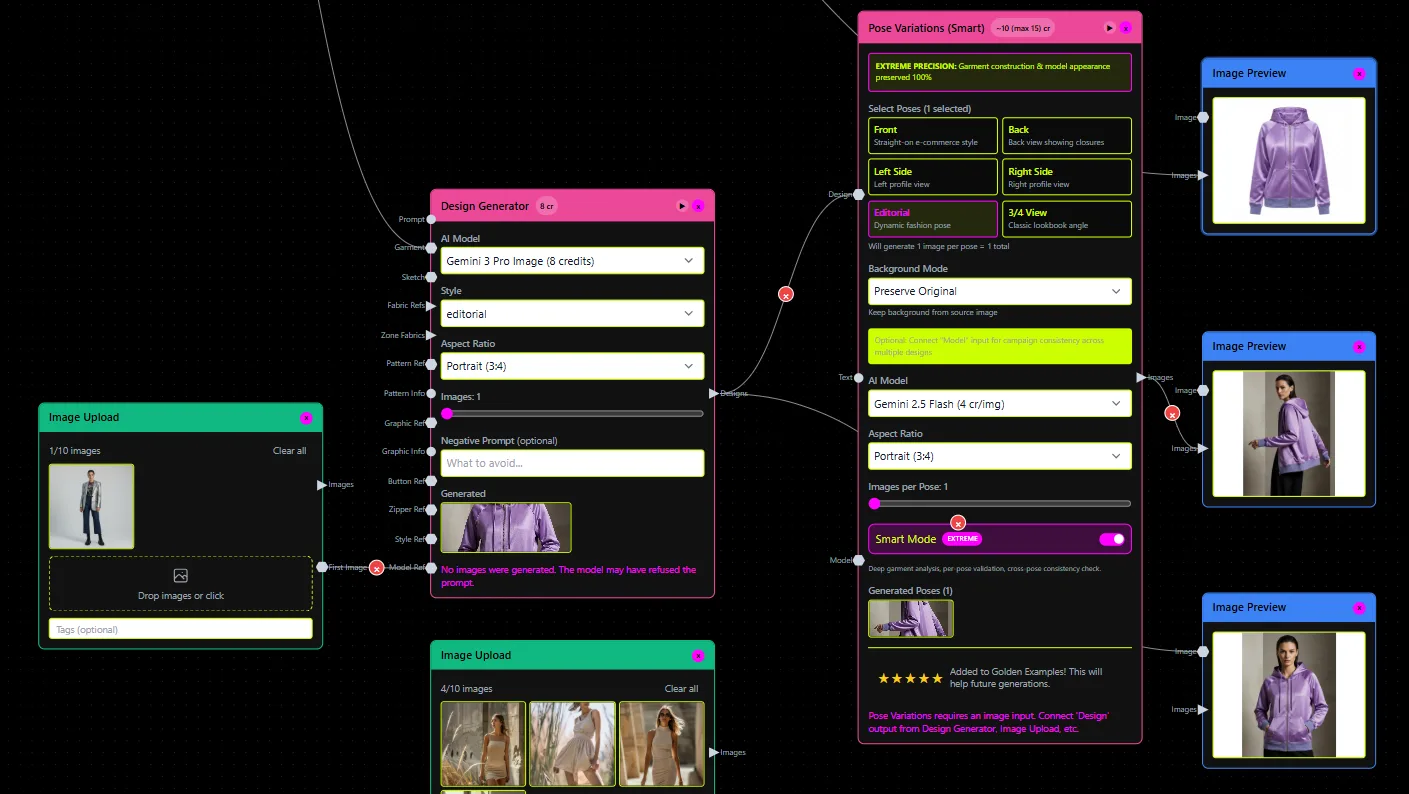
Calculate the delta per KPI
For each operational metric, compute:
Delta = Pilot_Average - Baseline_Average
A negative delta on Days_to_Production is good. A negative delta on Fit_Acceptance_Rate is a stop signal.
Translate deltas to financial value
Use agreed-upon conversion rules. Document the assumptions:
- Labor savings:
Delta_Hours x Fully_Loaded_Labor_Rate_per_Hour - Sample savings:
Delta_Sample_Count x Average_Physical_Sample_Cost - Fabric waste savings:
Delta_Fabric_Waste_m x Average_Fabric_Cost_per_Meter - Cycle time value: For brands where speed-to-market has revenue implications, apply an agreed overhead/margin-per-day figure. If this figure is contested, leave it out and report cycle time as a non-monetized operational metric.
Apply the ROI formula
ROI (%) = ((Total_Value_Created - Total_Cost_of_AI) / Total_Cost_of_AI) x 100
Net_Value = Total_Value_Created - Total_Cost_of_AI
Report both the percentage and the absolute net value. A 200% ROI on a very small pilot is less useful than a 60% ROI on a volume that can be annualized.
Annualize only when justified
To annualize: Annual_Value = (Net_Value_per_Style x Pilot_to_Scale_Factor) x Annual_SKU_Volume
The pilot-to-scale factor accounts for the reality that AI performance often improves as more brand-specific data is ingested. Conversely, at scale, governance and QA costs also increase. Be conservative. Apply a scale factor between 0.7 and 0.9 unless you have evidence that the workflow is fully stable.
McKinsey's 2026 State of AI survey found that only about 37% of respondents report AI contributing to measurable business outcomes organization-wide, with individual productivity gains still failing to translate into broad financial impact. This is the gap your measurement framework is designed to close.
A/B confidence thresholds
For A/B designs, compute the difference-in-means between cohorts. With a sample size below 30 per cohort, report a range using a simple sensitivity analysis (best case vs. conservative case) rather than a single-point ROI figure. State the confidence level explicitly. A result documented as "17% cycle time reduction, conservative estimate range 11-23%, based on N=25 styles" is more credible to a CFO than "20% improvement."
Before/after controls
Document any matched-style adjustments. If your pilot styles were all denim trousers and your baseline included a mix of categories, note that comparison and restate baseline using only matched denim trouser records. If seasonal demand shifted significantly, apply a matched-market adjustment or flag the attribution risk.
Step 5: Build the CFO-ready reporting package
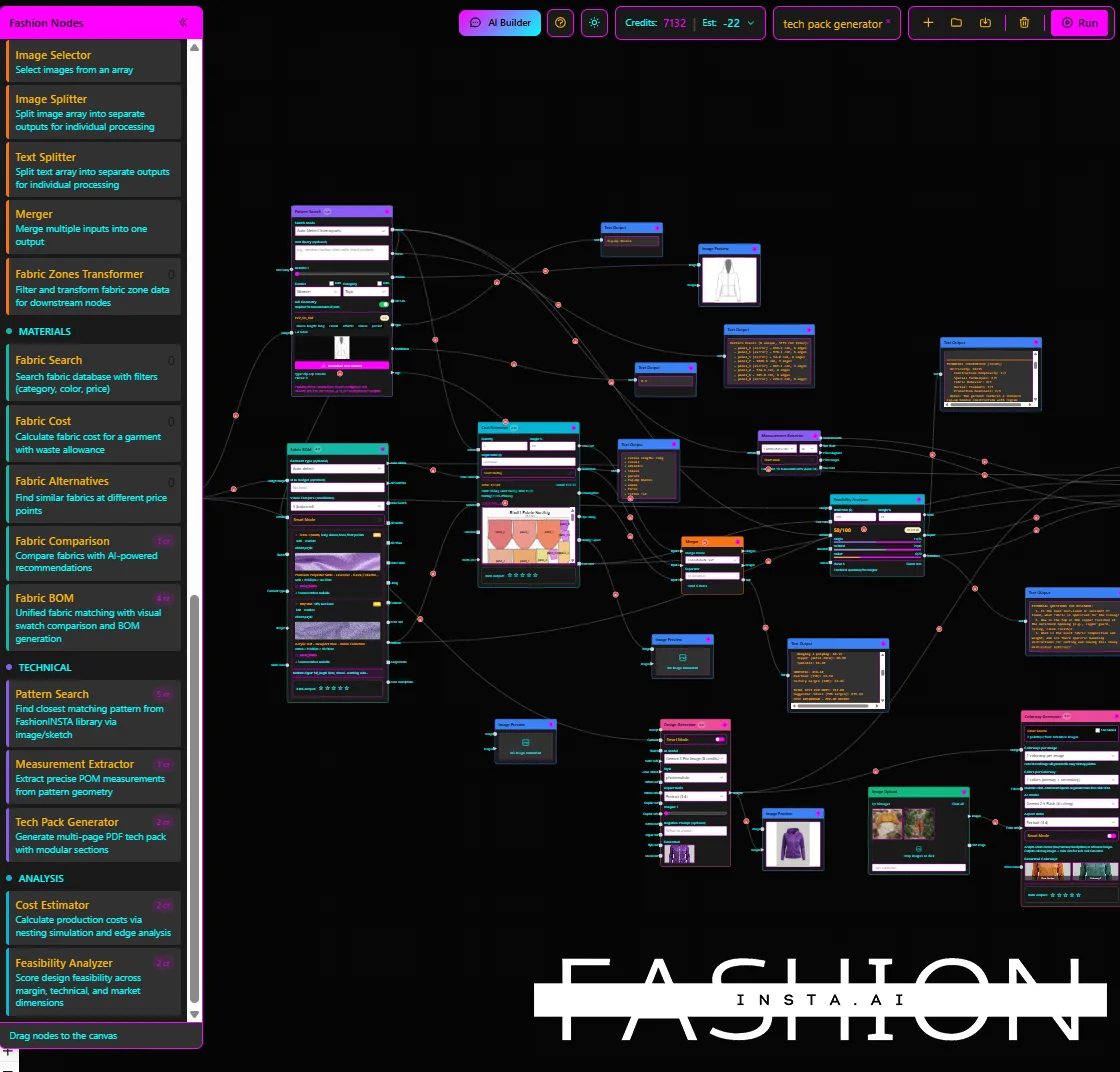
The one-page AI ROI pilot summary
Structure it in four blocks:
Block 1: Scope and design - Use case tested, cohort definition, pilot window, stabilization window applied, QA gate criteria, and sample size (N per cohort)
Block 2: Key deltas and value created - Table of each KPI: baseline average, pilot average, delta, financial conversion assumption, and value attributed. Total Value Created line at the bottom.
Block 3: TCO breakdown - Line-by-line costs: license/credits, onboarding, data prep, integration, governance/QA, compute. Total Cost of AI line at the bottom.
Block 4: ROI outcome and recommendation - Net Value, ROI %, annualized projection (with stated assumptions), and a clear recommendation: Scale / Iterate / Stop.
Budget vs. realized reconciliation
Add a table showing the originally forecasted costs and values vs. actuals. This is the section that builds long-term credibility with finance. Most AI pilots underestimate onboarding and governance costs by 30-50%. Showing that you tracked the variance honestly signals that future projections will be reliable.
Auditability section
State: where baseline data was pulled from (PLM, shared drive, manual log), who validated it, what the counterfactual was (control cohort or matched before/after period), and who owned QA verification of AI outputs. Deloitte's 2025 analysis noted that 85% of organizations have increased AI investment but only 20% can demonstrate measurable revenue outcomes. Auditability is precisely what separates the 20% from the rest.
Recommendation and backlog
End with a concrete decision: scale to full category, iterate on the pilot design, or stop and reassign budget. Include a short list of the next use cases queued for measurement, with rationale.
Step 6: Avoid the five most common pilot failures
Measuring tool usage instead of outcomes. Logging that your team used the AI tool on 80% of styles is not ROI data. Every metric must tie to a unit of value: per style, per sample, per tech pack. If you can't convert the metric to hours saved or cost reduced, it belongs in an adoption report, not an ROI calculation.
Ignoring hidden costs. If your pattern team spent 40 hours preparing and cleaning your archive for ingestion, that's a cost. If your IT team spent three weeks on security review and SSO configuration, that's a cost. Include them all in your TCO denominator. Platforms like FashionINSTA, for example, require initial training on a brand's proprietary pattern archive before the system can generate or score patterns with brand-specific fit geometry. That onboarding investment is real and belongs in the calculation.
Skipping the stabilization window. In the first weeks of using any AI-assisted workflow, outputs require more correction time, not less. Measuring ROI before the team and tool reach a stable working rhythm will produce a negative result that doesn't reflect steady-state performance. Enforce the stabilization window and exclude early-phase data from the ROI calculation.
Confounding variables left undocumented. If your pilot coincides with onboarding a new fabric supplier who delivers faster, your cycle time improvement isn't attributable to the AI tool. Document every process change that occurred during the pilot window. Note it in the reporting package. Your CFO will ask.
No stop rule for quality regression. Speed gains that come with a drop in fit acceptance rate or an increase in post-factory-review changes are not ROI. They are a shift of costs downstream, typically to more expensive correction points. Define a minimum acceptable quality threshold before the pilot starts, and build in an automatic stop rule: if fit acceptance rate drops more than X percentage points from baseline, the pilot pauses for investigation regardless of cycle time results.
Pilot design checklist before you start
Before collecting a single data point, confirm the following are in place:
- [ ] Single use case defined and scoped
- [ ] Measurement approach chosen (A/B or before/after)
- [ ] Minimum styles per cohort confirmed (20 minimum; 30+ preferred)
- [ ] Stabilization window defined and agreed (minimum 2-3 weeks excluded from ROI measurement)
- [ ] QA/acceptance gate criteria documented
- [ ] All three CSV templates populated with at least one test row
- [ ] Fully loaded labor rate agreed with finance
- [ ] TCO line items listed and assigned an owner for tracking
- [ ] Stakeholder sign-off template completed and signed
- [ ] Quality stop rules defined and documented
What comes after the pilot
A completed pilot with clean data is not the end of the process. It's the input to a scale decision. If the ROI is positive and the quality guardrails held, the next question is whether the workflow is repeatable across categories or seasons. If the pilot was run on one category (woven tops, for example), document the category-specific variables before assuming the same ROI will transfer to knitwear or outerwear.
If the pilot produced ambiguous results because the sample size was too small, or because a confounding variable was identified mid-pilot, the right call is to run a second, better-controlled iteration rather than forcing a scale decision on weak evidence. McKinsey's 2026 State of AI survey data, noting only 37% measurable business outcomes, reflects exactly this gap between AI activity and AI accountability. The measurement framework in this guide is designed to put your brand on the right side of that number.
The goal is not to produce an impressive-looking ROI percentage. The goal is to produce a number your CFO trusts, built on data your operations team actually collected, covering costs your finance team actually agreed to, against quality standards your factory actually validates.
That's the only ROI calculation that survives a board room.