AI Fashion Tool Evaluation Framework
TL;DR: Evaluating AI fashion design software requires moving beyond visually impressive demos to test for actual production readiness. This framework provides a structured approach to measuring geometry fidelity, CAD compatibility, and cost accuracy to ensure seamless workflow integration. Use our included pilot checklist and scoring rubric to make data-driven rollout decisions.

Vendor demos are optimized for impression, not production. A tool that generates a convincing front-view render in 30 seconds can still fail your workflow entirely if it exports nothing a CAD operator can open, or if it produces a different seam allowance every time you run the same input. Most AI tool pilots fail not because the technology is weak, but because the evaluation criteria were borrowed from the vendor's own demo script.
This framework gives fashion brands a structured, measurable process for evaluating any AI design tool before committing to rollout. It's built around production-ready outputs, not visual impressions, and it includes a one-page pilot checklist and a weighted scoring rubric with numeric thresholds you can copy directly.
Why demos lie and pilots fail
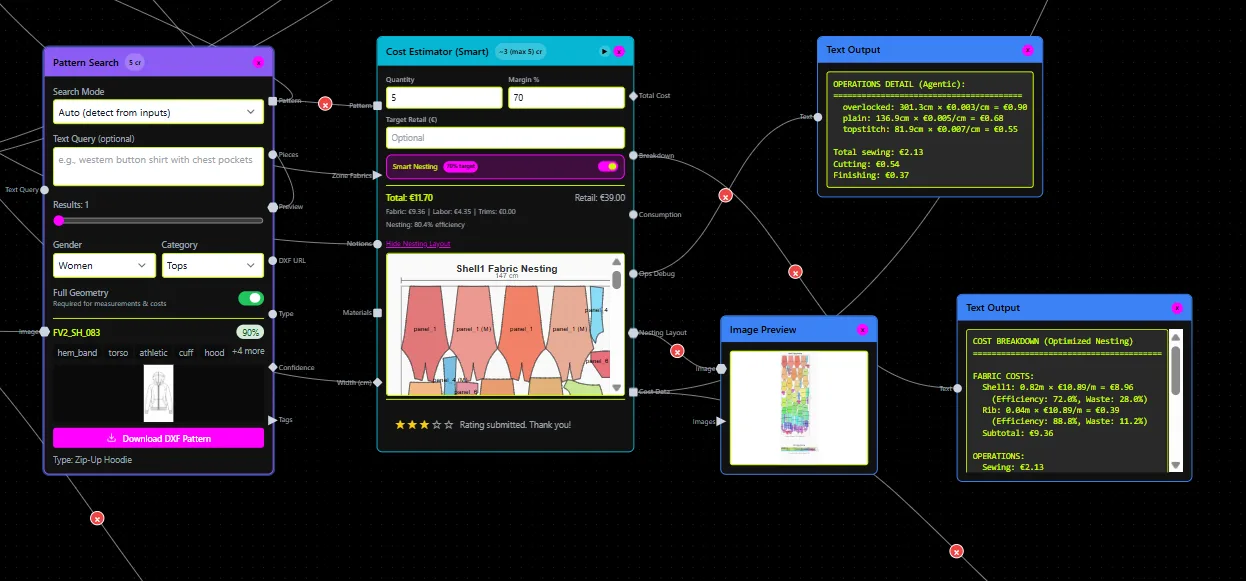
"Demo success" means the tool produced something visually plausible under controlled conditions. "Production readiness" means the tool reliably produces a manufacturable asset, on your inputs, within your workflow, with acceptable variance across repeat runs.
Stakeholders over-index on visual output because it's the most immediate and legible signal. But for apparel brands, the handoff that matters is a CAD-compatible .DXF file, a complete tech pack, and a cost estimate within acceptable tolerance. If any of those outputs fail, the visual quality is irrelevant.
Test the tool on your actual workflow handoffs, your ground truth assets, and your acceptance thresholds. Not the vendor's.
Step 1: Lock the pilot scope, baseline, and decision gate
Choose exactly one category for the pilot. One silhouette family, one construction type. Pilots that attempt to cover multiple categories simultaneously produce results that are too diffuse to act on.
Before you start, document your current baseline:
- Average pattern development cycle time (days)
- Rework rate (percentage of patterns requiring correction before sampling)
- Cost per completed tech pack (internal labor + external costs)
Define the go/no-go decision gate before the pilot begins, not after. A useful structure is a fixed-week review. FashionINSTA's Enterprise PoC, for example, runs for 10 weeks (2 weeks data collection, 2 weeks training and cleanup, 6 weeks active trial) and includes a week-10 KPI review to make the go/no-go call. Adopt the same discipline regardless of which tool you're evaluating.
Step 2: Build a test set that reflects real design variation
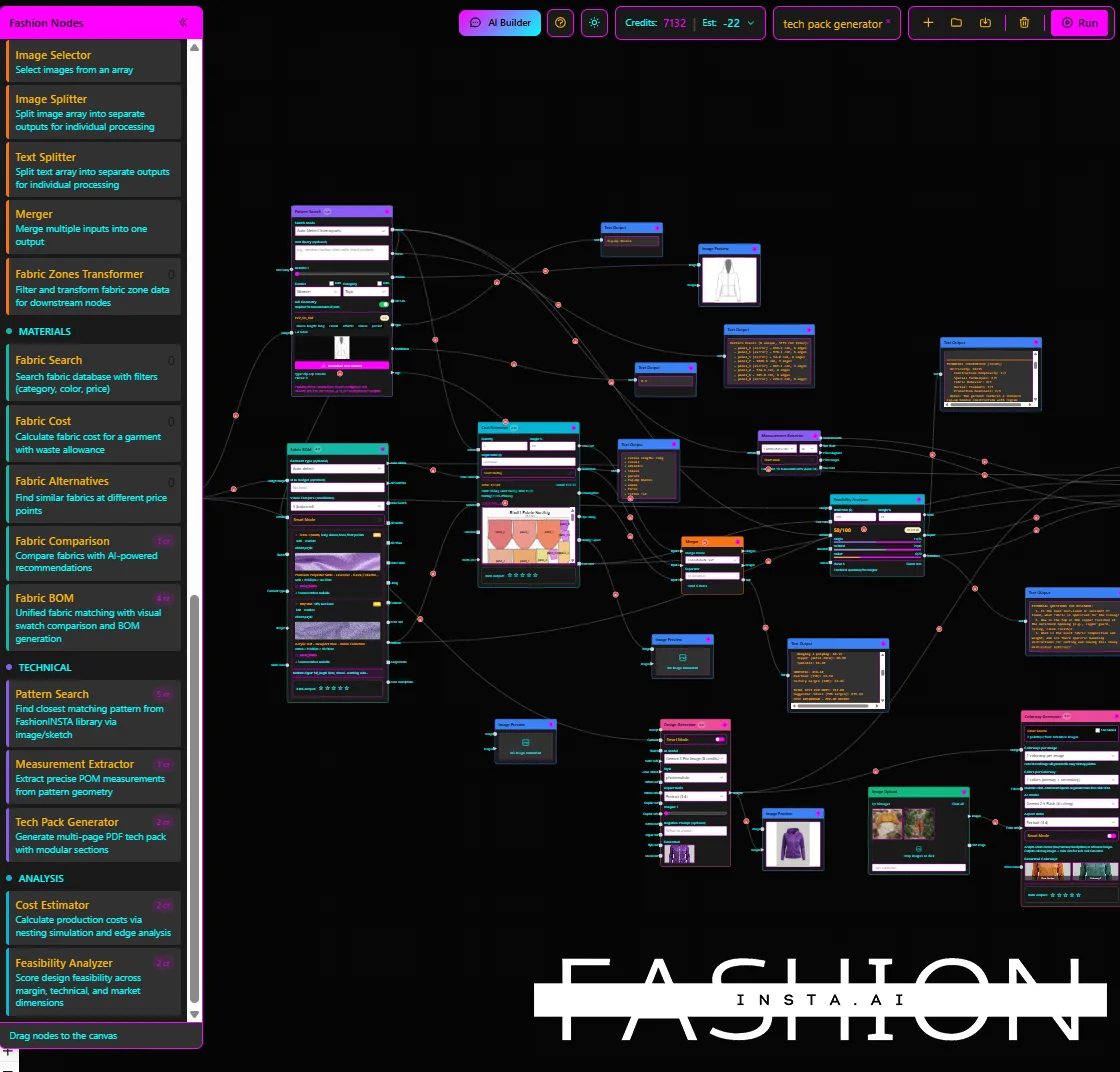
A test set of three representative designs is not a test. Include:
- 8 to 12 designs from the target category, spanning your typical variation in silhouette and construction
- At least 2 edge cases (unusual seam placement, non-standard grading range)
- Defined ground truth for each: an approved pattern geometry, an approved size chart, an approved tech pack
Plan to run each input at least three times with identical parameters. Variance across repeat runs (reproducibility variance score) tells you whether the tool is reliable enough to trust in production. Galileo AI and Prometheus Agency both emphasized this in published evaluation guidance from April and May 2026: tracking variance across runs is a more reliable signal than evaluating a single polished output.
Step 3: Score output quality with Pass/Fail gates
Score each output across four dimensions:
- Geometry fidelity: Does the output match the ground truth pattern geometry in fit-critical regions (neckline, armhole, crotch curve)? Score 0 to 10.
- Manufacturability: Are seam allowances consistent? Are notches placed correctly? Would this pattern cause problems on the cutting table? Pass/Fail.
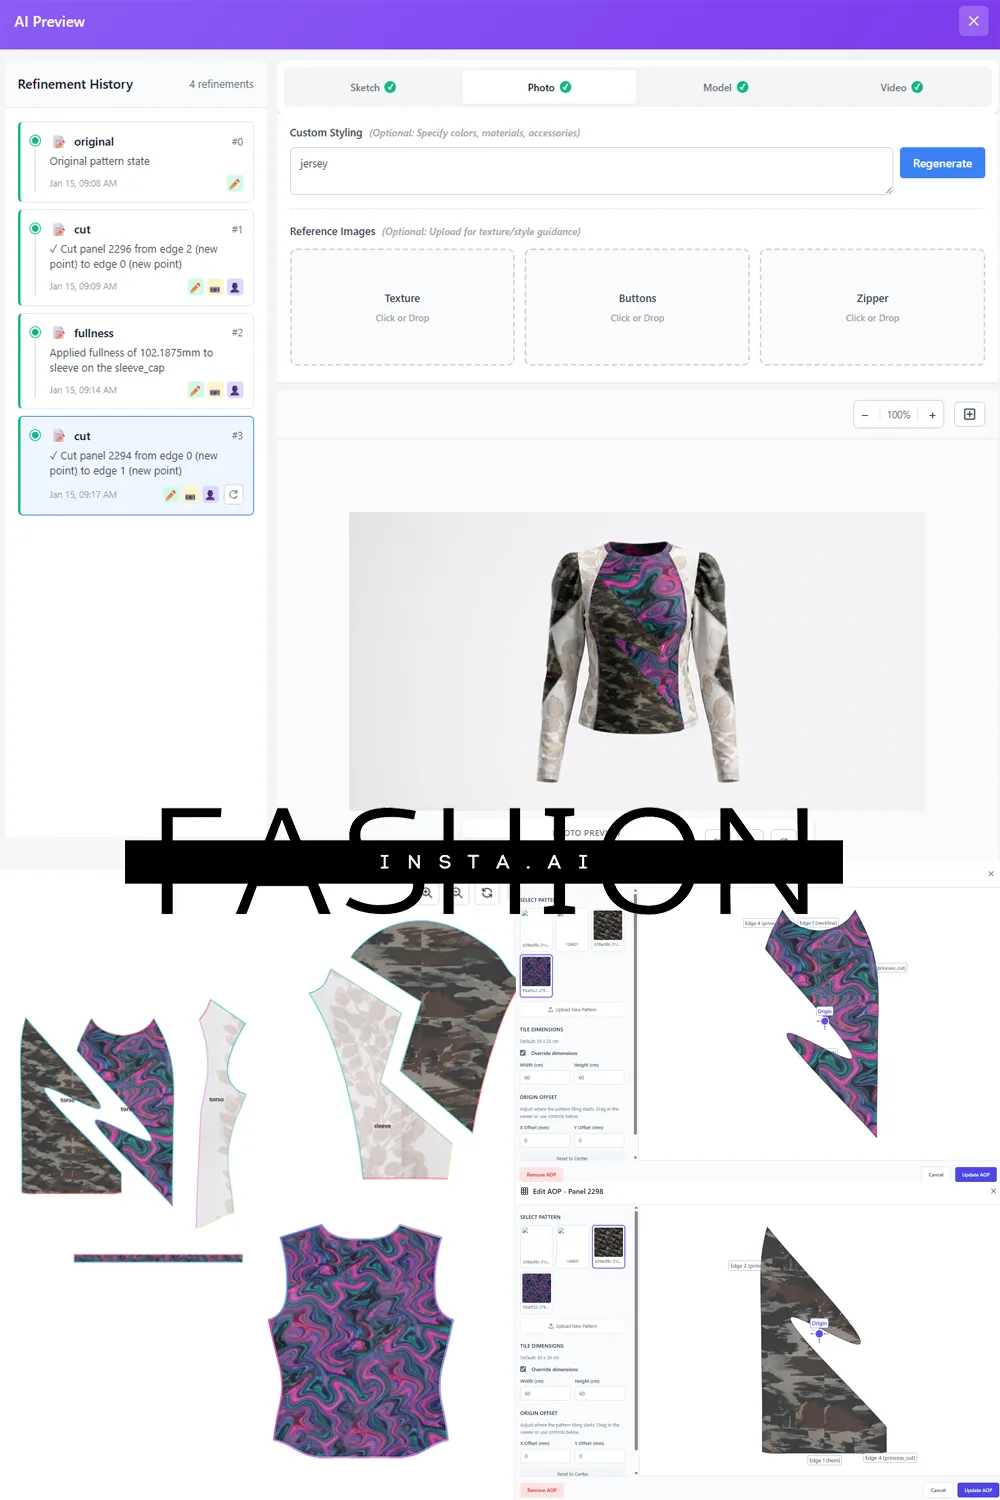
- Export readiness (DXF): Does the exported file open correctly in Gerber, V-Stitcher, CLO3D, or Lectra Modaris? This is a hard-fail gate. If the file doesn't open, the tool fails regardless of other scores. For fashion specifically, verify AAMA DXF and V-Stitcher DXF compatibility explicitly.
- Tech pack completeness: Does the output include measurements, construction notes, fabric specs, and colorway data? Score 0 to 10.
Classify every error: what requires human repair (soft fix) vs what constitutes a hard fail (missing or corrupt export, geometry deviation beyond tolerance).
Step 4: Measure time-to-production and adoption friction
Capture three timing metrics:
- Time to first production artifact from a new input (minutes or hours)
- Number of iteration cycles required to reach an acceptable output
- Total tool switches in the handoff sequence (how many applications does your team need to touch before the file is factory-ready?)
More tool switches means more opportunity for data loss and more adoption friction. Score each vendor on the total number of steps between design input and a factory-ready file.
Step 5: Evaluate cost and governance risk
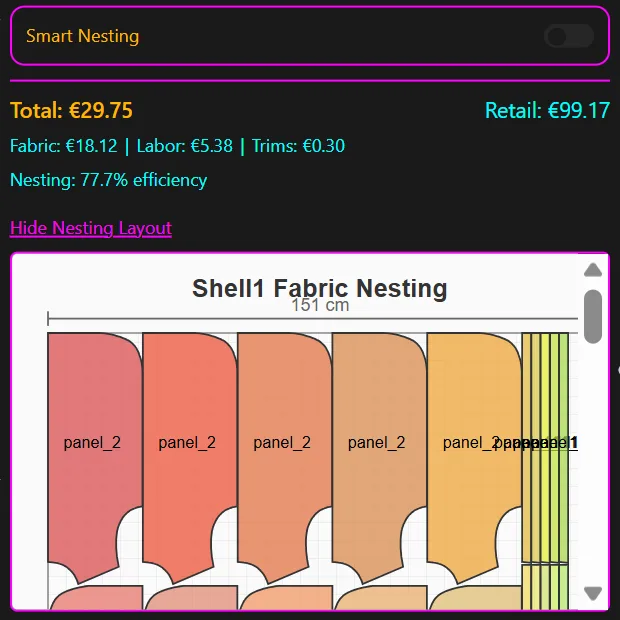
Cost accuracy matters more than headline price. Track actual cost per completed artifact during the pilot: labor time, credits consumed, and any cleanup work. Compare that to the vendor's estimate. FashionINSTA's cost estimation accuracy reaches approximately 80% when connected to correct BOM data, which is a reasonable benchmark to hold other tools to during evaluation.
For governance, don't accept verbal assurances. Ask for evidence of:
- Dedicated tenant isolation (your data does not share infrastructure with other customers)
- SSO and RBAC configuration
- Audit log access (exportable, timestamped records of who did what)
- A signed NDA and Data Processing Agreement before any proprietary patterns are shared
Under the EU AI Act, deployers of AI systems in regulated or high-risk contexts face documentation and transparency obligations. Even if your use case isn't classified as high-risk today, a vendor who can't provide audit logs or model documentation is a liability. Ask for evidence, not promises.
One-page pilot checklist
Print and complete this before the pilot begins. Assign an owner to each item.
Pilot scope - [ ] Single product category defined: ___ - [ ] Baseline cycle time documented: ___ days - [ ] Baseline rework rate documented: % - [ ] Go/no-go decision date set: ______
Test set - [ ] 8 to 12 representative designs selected - [ ] At least 2 edge cases included - [ ] Ground truth files (patterns, size charts, tech packs) locked and versioned - [ ] Repeat-run protocol defined (minimum 3 runs per input)
Success gates - [ ] Minimum geometry fidelity score: ≥ 7/10 - [ ] DXF export opens in target CAD system: Pass (hard gate) - [ ] Tech pack completeness score: ≥ 7/10 - [ ] Reproducibility variance: ≤ 10% deviation across repeat runs
Export and workflow readiness - [ ] CAD format compatibility confirmed (AAMA DXF, V-Stitcher, CLO3D, or Lectra Modaris) - [ ] Total handoff steps from input to factory-ready file counted: ___
Cost tracking - [ ] Credits or API cost per artifact tracked from day 1 - [ ] Cost estimate accuracy target: ≥ 75%
Governance - [ ] NDA and DPA signed before data transfer - [ ] Tenant isolation confirmed (dedicated, not shared) - [ ] SSO/RBAC configured - [ ] Audit logs accessible and exportable - [ ] Vendor provides written pilot plan with KPIs
Weighted scoring rubric
Use this rubric to score each tool at the end of the pilot. Scores are on a 0 to 10 scale per criterion, then multiplied by the weight. Maximum total: 100 points.
| Criterion | Weight | Pass threshold | Hard fail condition |
|---|---|---|---|
| Output quality (geometry, manufacturability, tech pack completeness) | 40% | ≥ 7.0 | Any geometry deviation in fit-critical region > 15% from ground truth |
| Reproducibility (variance across 3+ repeat runs) | 15% | ≤ 10% variance | > 25% variance = automatic fail |
| Export/workflow readiness (DXF compatibility, handoff steps) | 20% | CAD file opens, ≤ 4 handoff steps | DXF export fails to open = hard fail |
| Time-to-production | 10% | First artifact ≤ 2 hours | > 8 hours per artifact = fail |
| Cost accuracy | 10% | ≥ 75% estimate accuracy | < 50% accuracy = flag for re-evaluation |
| Risk/governance readiness | 5% | All four governance items confirmed | No audit log capability = flag |
Score interpretation:
- 85 to 100: Proceed to phased rollout
- 70 to 84: Re-run pilot with corrections to flagged criteria before rollout
- 55 to 69: Significant gaps; address hard fails or do not proceed
- Below 55: Stop; do not proceed to rollout
Note: Any hard-fail condition disqualifies the tool from rollout regardless of total score.
Example filled scorecard (two tools, illustrative values)
The following values are examples only, intended to illustrate scoring logic.
| Criterion | Weight | Tool A score | Tool A weighted | Tool B score | Tool B weighted |
|---|---|---|---|---|---|
| Output quality | 40% | 8.0 | 32.0 | 6.5 | 26.0 |
| Reproducibility | 15% | 7.5 | 11.25 | 5.0 | 7.5 |
| Export/workflow readiness | 20% | 9.0 | 18.0 | 3.0 | 6.0 (hard fail) |
| Time-to-production | 10% | 8.0 | 8.0 | 7.0 | 7.0 |
| Cost accuracy | 10% | 7.5 | 7.5 | 8.0 | 8.0 |
| Risk/governance | 5% | 8.0 | 4.0 | 6.0 | 3.0 |
| Total | 80.75 | Hard fail |
Tool B scores well on cost accuracy but fails the DXF export gate. High visual quality combined with a failing DXF export is a hard fail for any fashion rollout. The total score doesn't matter when a hard gate is not met.
How to interpret scores and make the rollout decision
Three outcomes are possible:
- Proceed: Score ≥ 85 with no hard fails. Begin a limited rollout with one team, monitor production metrics weekly, and expand after 4 to 6 weeks of stable output.
- Re-run pilot: Score 70 to 84, or one soft failure (e.g., cost variance above threshold). Identify the specific failure, request a vendor fix or configuration change, and run a 4-week follow-up test on the failing criteria only.
- Stop: Any hard fail, or score below 70. Document the reasons and re-enter the AI tool selection process with revised vendor criteria.
Don't move to rollout until reproducibility is stable and the handoff sequence is documented end-to-end. Those two conditions are the practical minimum for production trust.
What to ask vendors on day 1
Request all of the following before signing anything:
- Three sample outputs from inputs similar to your category, with the raw export files included (not screenshots)
- A demonstration of DXF export opening in your target CAD system, live or recorded
- A written pilot plan specifying KPIs, timelines, and go/no-go criteria
- A reproducibility test protocol: what parameters are fixed, how many repeat runs, and how variance is measured
- Audit log screenshots or a live demo of the audit log interface
- Evidence of tenant isolation (architecture diagram or security documentation)
- References from at least one brand in a comparable product category
A vendor unwilling to provide these before the pilot begins is signaling that their evaluation process is designed around their demo, not your production workflow. That's the most important signal you'll receive.